How to add a chart to an email
Email clients don't run JavaScript, so a charting library can't work in a newsletter or transactional email. A YakCharts URL returns a PNG, so you embed it with a plain <img> tag — and it renders a current chart every time the email is opened. The recipes below cover what email uniquely needs: numbers printed on the chart (no hover tooltips), retina sharpness on phones, and dark-mode-safe backgrounds.
1. One img tag
<img src="https://yakcharts.com/api/chart.png?apiKey=YOUR_KEY&type=bar&data=%5B%5B%22Q1%22%2C12%5D%5D" alt="Revenue">That's the whole integration. Every recipe below is just extra query parameters on the same URL.
2. Print the numbers on the chart
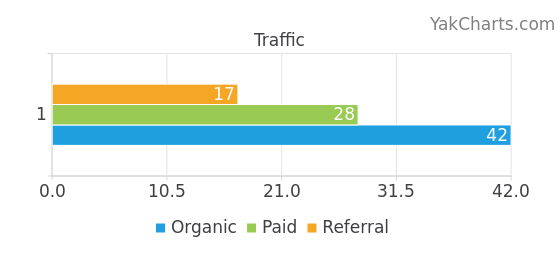
An email image has no hover tooltips, so put the values where the reader can see them: add {"showValues": true} to options for bars and lines, {"labelFormat": "percent"} for pie slices, or {"centerLabel": "72%"} in a donut hole. Big numbers? {"localizeNumbers": true} adds thousands separators.
3. Crisp on phones
Most email opens are on high-DPI phone screens. Add &scale=2 and display the image at its original CSS size — same layout, double the pixels, retina-sharp.
<img src="...&width=560&height=280&scale=2"
     width="560" height="280">
4. Dark mode without the white box
Dark-mode email clients put a white chart card on a dark background. Add {"transparent": true} to options and the PNG keeps an alpha channel, blending with whatever the client renders behind it. Pair with a theme whose text stays readable on your audience's likely background.
5. The KPI-digest shapes
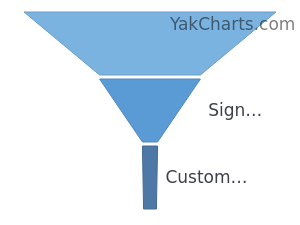
Four chart types built for metric emails: a sparkline beside each KPI number, a gauge for goal progress, a funnel for the pipeline, and a bullet chart for measure-vs-target rows.

6. Know who opened it
Tracked embeds persist the chart under a short token (/e/<token>.png) and log each load as an email open — with per-recipient tokens and verified-vs-proxy analytics, so Apple Mail prefetches don't inflate the numbers. The chart is the tracking pixel.
Caching & quota
Renders are deterministic: responses carry an ETag and Cache-Control, and 304 Not Modified revalidations are free — they never count against your monthly quota, even after it's exhausted.
See it work
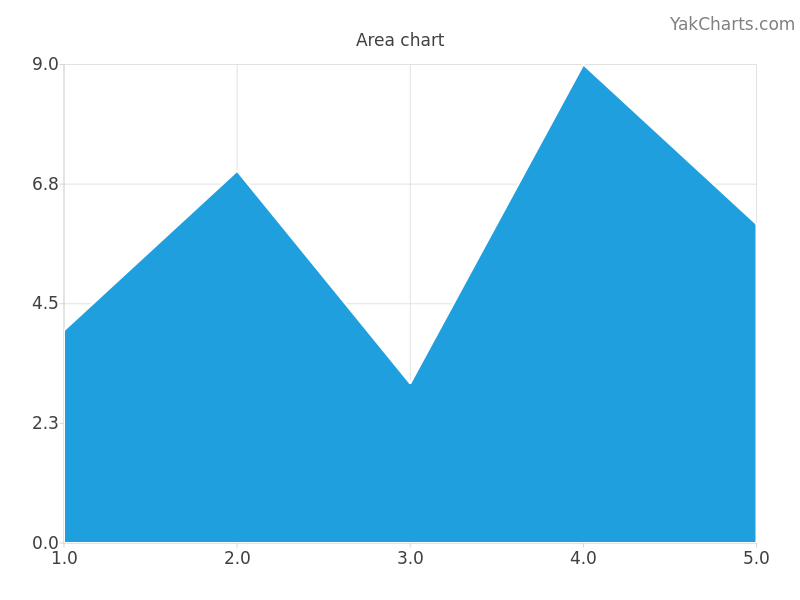
Put this chart in your own emails, reports and dashboards
YakCharts turns data into a PNG from a single URL — no charting library, no JavaScript, no screenshots. Free tier included; every plan has all 28 chart types.