How to make a chart image from Google Sheets data
Turn a row of Google Sheets data into a shareable chart image with a YakCharts URL — useful for embedding a live-looking chart in docs, emails and dashboards that Sheets' own charts can't reach.
Data in, PNG out
Build the data array from your cells and request /api/chart.png. Use IMAGE() in a cell, or export the URL to wherever the chart needs to live.
See it work
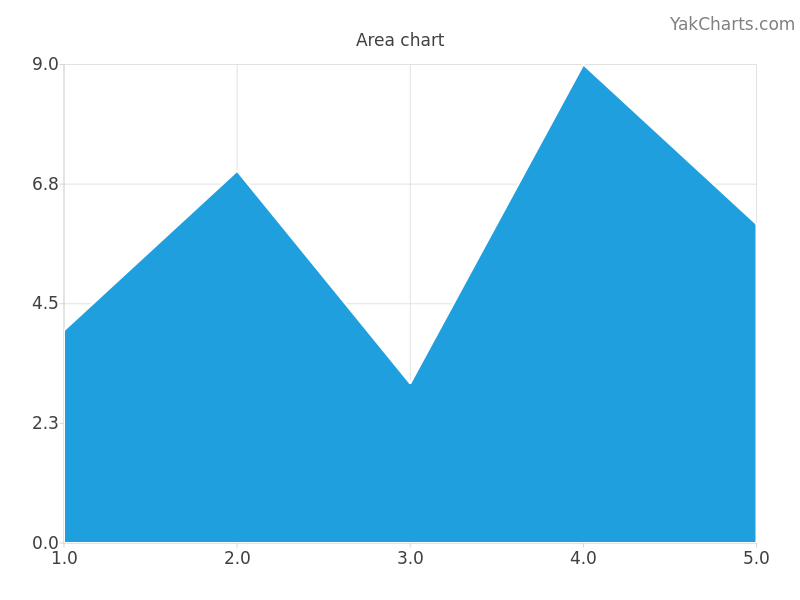
Put this chart in your own emails, reports and dashboards
YakCharts turns data into a PNG from a single URL — no charting library, no JavaScript, no screenshots. Free tier included; every plan has all 28 chart types.