How to add a chart to a GitHub README
GitHub READMEs render Markdown images but not JavaScript. A YakCharts URL gives you a chart as a PNG you can drop into any README, wiki or Markdown doc with standard image syntax.
Markdown image
See it work
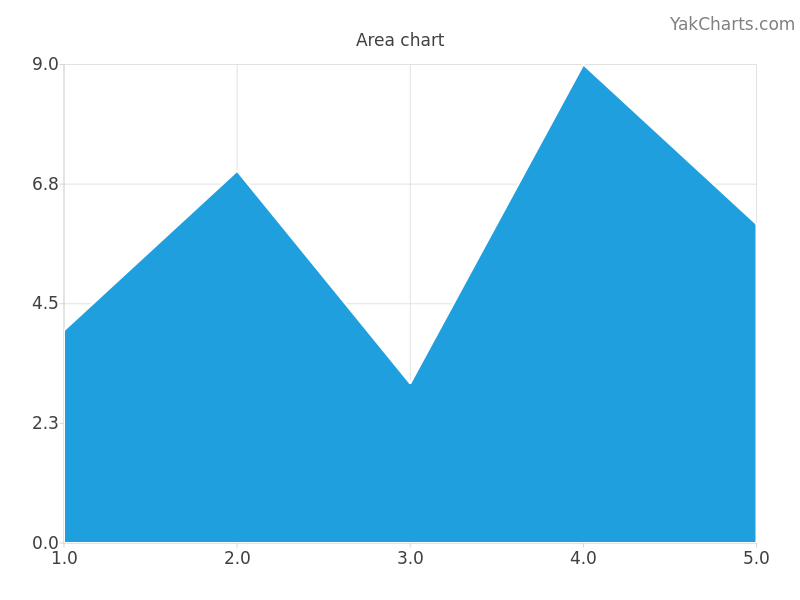
Put this chart in your own emails, reports and dashboards
YakCharts turns data into a PNG from a single URL — no charting library, no JavaScript, no screenshots. Free tier included; every plan has all 28 chart types.